


Article
• April 8, 2011
Communicate and Organize Your Everyday Info
Collect and visualize your most important data with DAYTUM
Studies show 64% of the population realizes that personal statistics are a great way to stay on top of personal goals, but a full 80% are only experiencing their data via boring spreadsheet. To us, that’s 100% tragic.
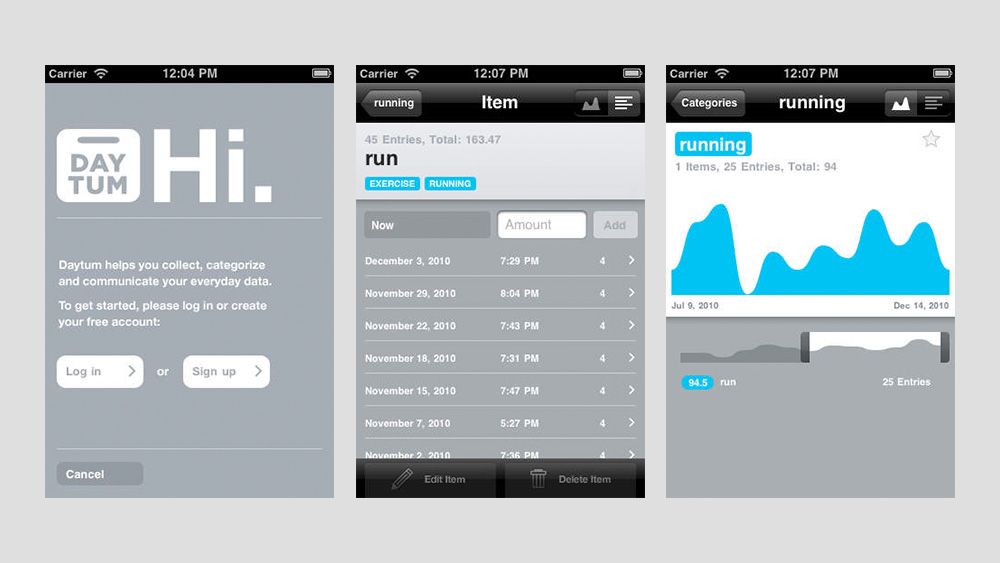
DAYTUM takes data collection and communication to a new level. Whether you’re tracking your workout routine or your favorite sports team, they offer fully customizable ways to monitor data that’s important to you and present it in the most beautifully designed, easy-to-digest ways possible.
By collecting seemingly mundane stats (“I ran 3.4 miles today,” “I spent 4 weeks in 10 Asian countries”) and presenting them in a strikingly gorgeous infographic form, your information actually becomes a story in itself. According to DAYTUM, collecting and exploring your data is what “reveals the bigger picture.”
The beauty of it all is that you can go as big or as small as you’d like. So far, we’ve used it to cut down on our caffeine intake. The site’s co-creator, on the other hand, mapped out his father’s entire life, including everything from hours worked to concerts attended.
And to think the only thing that used to get us excited about stats was hearing the word “pie.”
Sign up for our newsletter introducing you to the best sites, apps, and connected products.

Sign up for our newsletter introducing you to the best sites, apps, and connected products.